Spreadsheet View
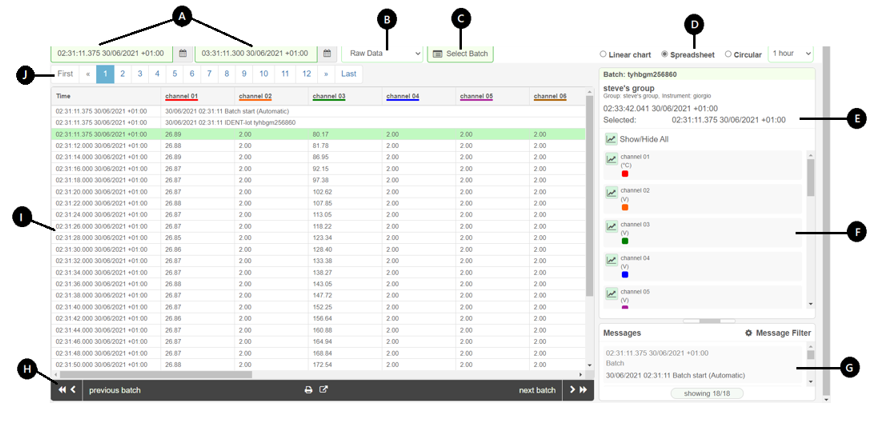
Set the start and end date and time range for the data shown.
Note: If you select a date or time that exceeds the data range available in the database, the final data point's date and time is used instead.
Use the Sample Interval drop-down to set the same data at a different sample interval.
Allows you to easily locate a specific batch record from a linear chart or spreadsheet view.
- Click Select Batch.
The GoTo Batch dialog box appears and displays all the available batches for the specific group (same as Batch cards view). - Enter a meaningful text, and/or set the date and time to refine your search results.
Note: Search options will be read-only if you have opened the chart / spreadsheet from the batch cards. See setting the filter options on the batch cards.
- Click the Show/Hide details button to show additional batch information such as the file name, start / end time, predefined batch fields, started by, stopped by etc.
Note: Only available if there are any additional information to show for the specified batches.
- Select a batch from the list to instantly move the chart view to the beginning of the selected batch or to jump to the relevant row on the spreadsheet.
- Click Leave batch mode to exit the batch mode or Close to exit.
Shows the group name (or the batch name) and the date and time of the selected row.
Displays all channels that can be shown on the spreadsheet, which includes the channel name, channel color and units.
By default, all channels are shown. Click on ![]() to show or hide channel / channels.
to show or hide channel / channels.
The message panel shows annotations, alerts and messages that were added to the history file by the recorder before the file was uploaded. It also shows any annotations added after the import.
Note: If required, click, hold and drag the bar that separates the Channel and the Message panels to make the Message panel bigger (or smaller)

If required, filter the message list. Click on Message Filter and select which type of messages are required to be shown.
Up to the first 20 messages are available to view. If there are more messages (D), click on load more (showing 20/*******) to load more messages in the message panel, in batches of 20.
Click on a message to take you to the relevant row on the spreadsheet.
- (A) Black: 'Other' messages
- (B) Red: Alarm messages
- (C) Blue: Annotations created in the visualization
| Icon | Description |
|---|---|

|
Moves backward in time as set in default chart view |
| previous batch | Only for batches. Jumps to the previous batch. This will be invisible if there is no previous batch. |
| next batch | Only for batches. Jumps to the next batch. This will be invisible if there are no further batches. |

|
Takes you to the print settings page. If required, customize the spreadsheet view before printing. |

|
Exports the raw data as a CSV (Comma Separated Value) file for analysis |

|
Moves forward in time as set in default chart view |
Shows the recorded data (or specific batch) as a list of process variables rather than a chart. This is not the same as CSV export or table of values in print view.
Note: All dates and times are shown in instrument time.
Use the page navigation bar to navigate through the pages.